5 government graphs that put Conservative climate change skeptics on defensive
A new report by the federal government spells out how climate is changing in Canada — and why people can expect more extreme weather episodes with global warming worsening and Ottawa’s efforts lagging. Canada in a Changing Climate by Natural Resources Canada (NRCan) acknowledges that “more work is needed” as “changes in climate are increasingly affecting Canada’s […]
A new report by the federal government spells out how climate is changing in Canada — and why people can expect more extreme weather episodes with global warming worsening and Ottawa’s efforts lagging.
Canada in a Changing Climate by Natural Resources Canada (NRCan) acknowledges that “more work is needed” as “changes in climate are increasingly affecting Canada’s natural environment, economic sectors and the health of Canadians.”
The findings by non-partisan experts at NRCan are in stark contrast to conclusions made just a few weeks ago by Conservative MPs on the House of Commons natural resources committee. Their reportconcluded that the development of the oil and gas industry “generates various environmental benefits, including improved air quality, water quality, and reforestation.”
NRCan’s report also follows a statement by B.C. Conservative MP James Lunney, who challenged the science of climate change last week, just as the Harper government approved the Northern Gateway Pipeline.
Here are 5 NRCan graphs for Lunney and other climate skeptics:
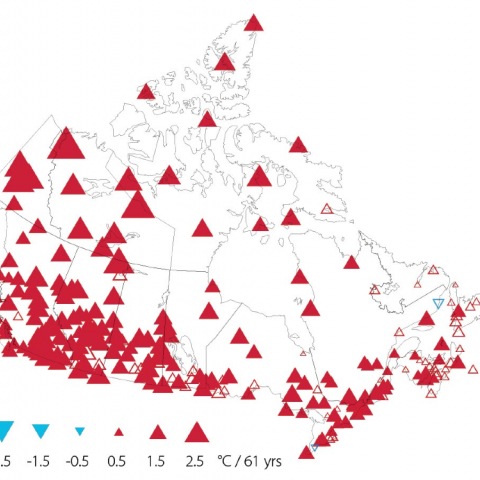
1. Over the last six decades, “Canada has become warmer, with average temperatures over land increasing by 1.5 Celsius between 1950 and 2010. This rate of warming is about double the global average reported over the same time period.”

2. The graph below shows the “Arctic has seen rapid decline in sea ice extent, both in summer and winter” between 1979 and 2012. “Both trends are statistically significant.”

3. The graph below shows the historical and projected number of hot days and warm nights for selected cities in Canada.

4. The graph below points out that “statistically significant negative trends have also been observed during the spring over the Canadian land mass with declines in snow cover of 7%, 13% and 35% in April, May and June, respectively, over the 1972-2010 period.”

5. With “growing confidence” that extreme weather episodes “will increase in frequency and/or intensity due to climate change,” the graph below breaks down the economic costs.

Our journalism is powered by readers like you.
We’re an award-winning non-profit news organization that covers topics like social and economic inequality, big business and labour, and right-wing extremism.
Help us build so we can bring to light stories that don’t get the attention they deserve from Canada’s big corporate media outlets.
Donate